 Image: NIH Image Gallery, public domain, via Wikimedia Commons
What an fMRI scan actually measures
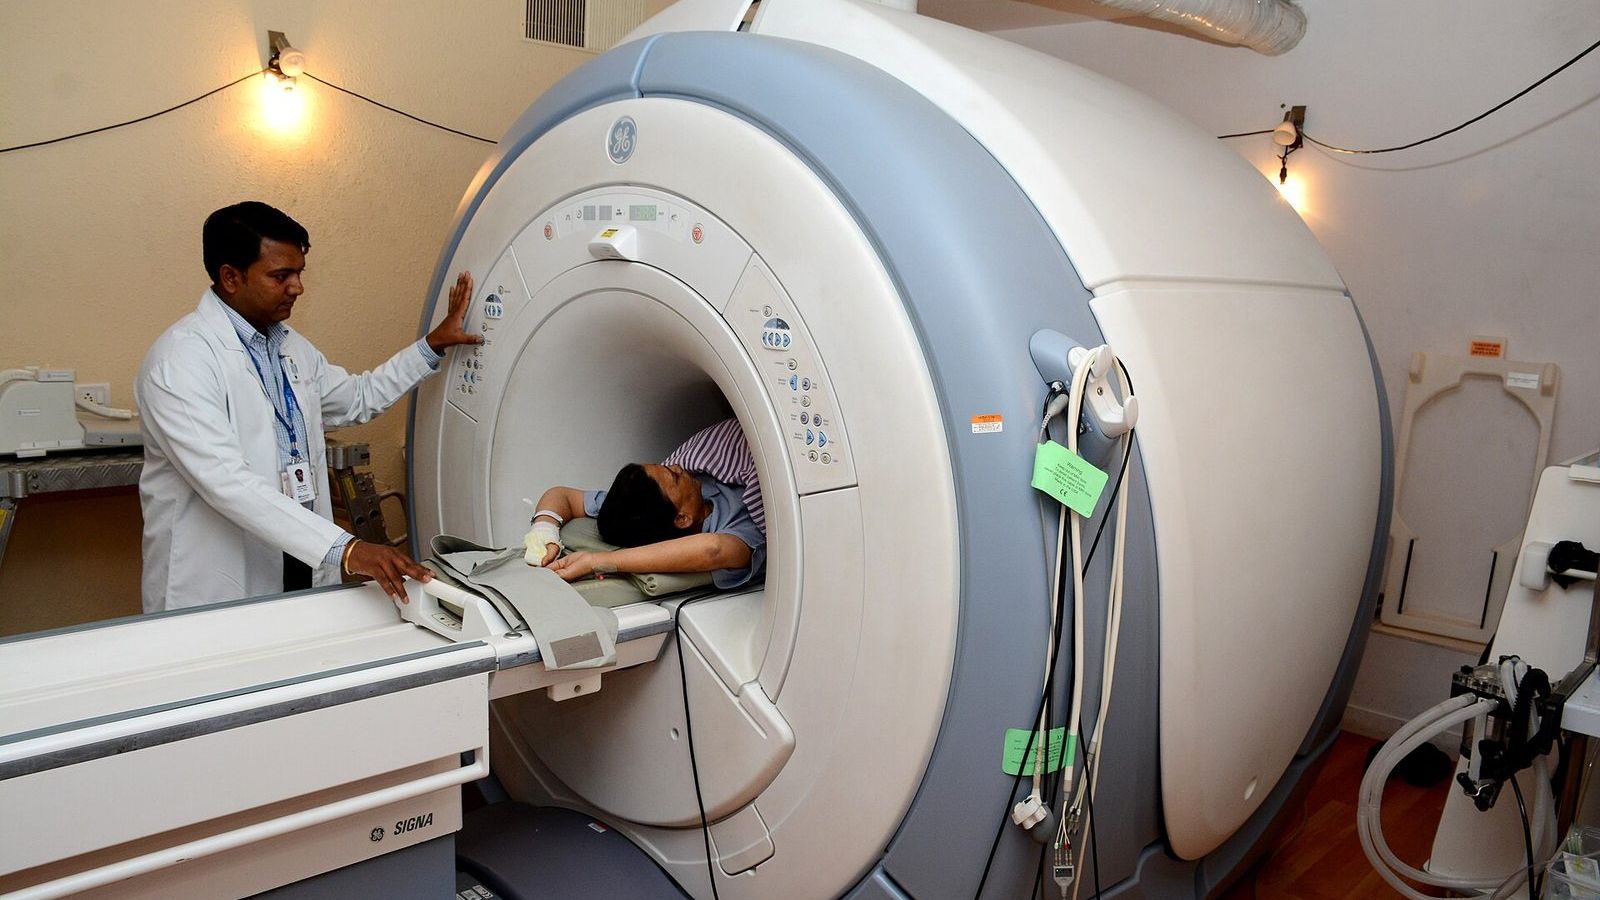
Functional magnetic resonance imaging measures blood rather than neurons. When a patch of cortex becomes more active, the vessels around it dilate within a second or two and deliver more oxygenated blood than the tissue uses, so the local proportion of oxygenated to deoxygenated haemoglobin rises. Deoxygenated haemoglobin is slightly magnetic and disturbs the field of the scanner; oxygenated haemoglobin is not. The scanner detects the change as a small increase in signal, typically 1 to 3%, that begins about two seconds after the neural activity, peaks at about five or six seconds, and returns to baseline after fifteen or more. That is the BOLD signal, blood-oxygen-level-dependent, discovered by Seiji Ogawa in 1990, and the curve is the haemodynamic response.
The signal is slow, indirect, and small, and three questions follow from each of those words. What neural activity does it track? How is a 2% change turned into a coloured map? And what can the map tell you about what the person was thinking?
What the blood is tracking
The best answer comes from experiments that recorded electrodes and BOLD in the same tissue of monkeys at the same time. Nikos Logothetis and colleagues found that the BOLD signal follows the local field potential, which reflects the synaptic input arriving at a region and its local processing, more closely than it follows the spikes the region's neurons send out. A region can show a strong BOLD response while sending nothing onward, and inhibition, which costs energy, can raise the signal as well as excitation. Logothetis's 2008 review in Nature, "What we can do and what we cannot do with fMRI", is at the journal and is the honest account.
The spatial unit is the voxel, a volume element usually 2 to 3 mm on a side. A single voxel of cortex contains several hundred thousand neurons and tens of millions of synapses, and the scanner reports one number for all of them every one to two seconds. Whatever is happening at the level of individual neurons, fMRI sees its average over a population that is large even by the standards of the brain.
How a map is made
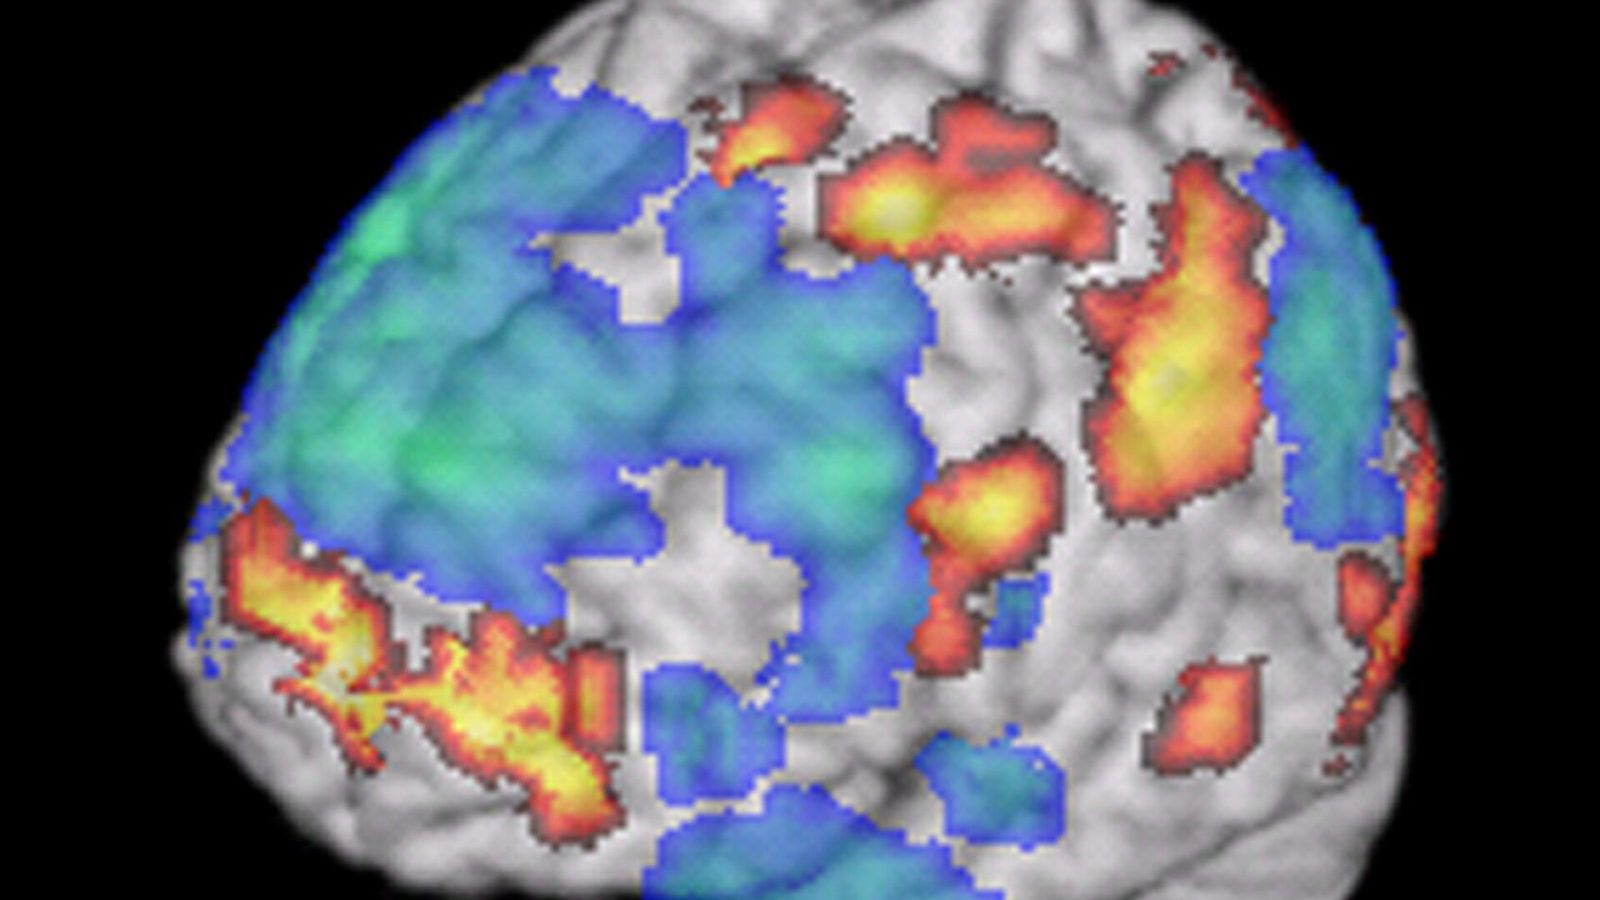
Nobody can see activity in a raw scan. A scan of a person doing nothing and a scan of the same person doing arithmetic look identical. The map comes from subtraction: the person alternates between a task and a control, perhaps 30 seconds of each, many times, and for every voxel the analysis asks whether the signal was reliably higher during the task than the control. The result is a statistical test in every voxel, about 100,000 of them, and the colour in the picture is the size of the test statistic in the voxels where it passed a threshold. The grey brain underneath is a separate anatomical scan on which the statistics are painted. The picture is a map of where a hypothesis test passed.
Running 100,000 tests at once creates a problem that the statistics of Unit 1 predict. At a threshold of p below 0.05, 5,000 voxels would pass by chance in a brain that was doing nothing at all. In 2009 Craig Bennett and colleagues put a dead Atlantic salmon in a scanner, showed it photographs of people in social situations, and asked it to judge their emotions. With the uncorrected threshold that many papers of the time used, a small cluster of voxels in the salmon's brain cavity responded to the task. The point was that the correction for multiple comparisons, which every proper analysis applies, has to be made every time. The poster won an Ig Nobel Prize and changed reviewing practice.
The correction has its own difficulties. In 2016 Anders Eklund, Thomas Nichols, and Hans Knutsson tested the most common correction methods on resting-state data in which no effect should appear and found that one widely used method produced false positives in up to 70% of analyses rather than the expected 5%, because an assumption about the shape of the noise was wrong. The paper, in PNAS, is free to read, and the software was fixed. How many published results it affected is still argued about.
The same data, seventy analyses
The clearest demonstration of how much the analysis matters came in 2020. Rotem Botvinik-Nezer and colleagues gave the same fMRI dataset, from 108 people doing a gambling task, to 70 teams and asked each to test nine hypotheses using whatever pipeline they usually used. No two teams chose the same pipeline. For four of the nine hypotheses the teams disagreed substantially on whether there was an effect, and for one the split was close to even. The underlying statistical maps were correlated across teams; the yes-or-no conclusions were not. The paper, in Nature, is at the journal, and the lesson is that a single fMRI result is a result of one analysis among many defensible ones, which is one of the reasons the field now preregisters pipelines and shares data on archives such as OpenNeuro.
From a blob to a thought
Suppose the analysis is sound and a region responded. The news report says that the region is the brain's fear centre, so the person was afraid. This is reverse inference: reasoning from activity in a region back to a mental state. It is valid only to the degree that the region is specific to that state, and most regions are not. The amygdala responds to fear; it also responds to novelty, to reward, to faces, to ambiguity, and to almost any arousing stimulus. Russell Poldrack showed in 2006 how to put a number on the inference with Bayes' theorem and how weak it usually is; his paper in Trends in Cognitive Sciences is at the journal. The database Neurosynth, which has read the coordinate tables of more than 14,000 studies, will tell you for any region how specific it is to any term, and the answer for the amygdala and fear is: not very.
How to read one in the news
Five questions settle most cases. How many people were scanned, and is the number in double figures? What was the control condition, since the map shows only the difference? Was the threshold corrected, and was the analysis preregistered? Is the claim about where something happened, which fMRI can support, or about what the person was feeling, which it usually cannot? And has the result been replicated, given that a 2020 study of common fMRI tasks found that the activity of individuals in the same region was unreliable from one session to the next even when the group map was stable?
None of this makes fMRI useless. It has mapped the visual system in detail, located language before surgery in thousands of patients, and shown awareness in patients who could not move, which Unit 16 describes. It is a good instrument with a slow, indirect signal and a long chain of analysis between the magnet and the picture, and Unit 13 of the masterclass walks along that chain so that the picture can be read for what it is.