

Brain Imaging and Stimulation
Every claim about the living brain rests on an indirect measurement. This unit explains what EEG, MEG, structural and diffusion MRI, PET, and fMRI record, how a BOLD signal arises from blood flow and why it lags a thought by five seconds, how the statistics of 100,000 voxels produce false positives unless they are corrected, why an active amygdala does not mean fear, and what 70 teams found when they analysed one dataset. It ends with the stimulation methods that give causal evidence and a six-question checklist for reading a brain image in a paper or in the news.
Every claim of the next three units rests on a measurement of a living brain, and every one of those measurements is indirect. An electrode on the scalp records a blurred sum of millions of synaptic currents, a scanner records the oxygen content of blood, and a coloured blob in a journal is a statistic, so a reader who does not know what each method records and what it cannot see will believe too much or too little. This unit explains the instruments of cognitive neuroscience from the single cell to the whole brain, works through the statistics that turn a scan into an image, and ends with a checklist for reading a brain image in a paper or in the news.
1 Levels of measurement and the logic of inference
The brain can be measured at every scale between a single ion channel and the whole organ, and no method covers more than a small part of the range. Figure 1 places the methods of this unit on two axes, the smallest piece of tissue a method can tell apart and the shortest interval of time it can resolve, and the first thing to notice is how little the boxes overlap. A microelectrode records the action potentials of one neuron (Unit 2) with a precision of a millisecond and a tenth of a millimetre. This is how David Hubel (1926-2013) and Torsten Wiesel found in 1959 that neurons of the visual cortex of the cat respond to edges tilted at one particular angle, a discovery that earned them the Nobel Prize of 1981. The method needs an opened skull, so in humans it is used only in patients who already have electrodes implanted before epilepsy surgery. At the other corner, a lesion study compares a person before and after a stroke and can resolve nothing shorter than months. The two methods that dominate human research, electroencephalography and functional magnetic resonance imaging, occupy opposite corners of the middle ground, and Sections 2 and 4 explain why.
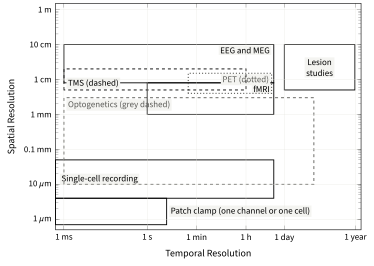
The oldest method is also the one with the clearest logic. Unit 2 stated it in one sentence: if a region is destroyed and a function disappears, the region was necessary for that function. Recording methods cannot say this. An electrode or a scanner shows that a region is active while a task is performed, which is a correlation in the sense of Unit 1, and a region can be active during a task without being needed for it, as the heart beats faster during an examination without doing any of the thinking. A lesion is an intervention, and interventions support causal claims.
Even a lesion needs care. A patient who fails one task after damage to one region may fail it because the task is hard, because the damage disconnected a distant region, or because the patient is tired, so a single impairment is ambiguous. The remedy, named by Hans-Lukas Teuber (1916-1977) in 1955, is to find two patients whose impairments point in opposite directions.