

Sensation and Perception
The world never reaches the brain; only the nerve signals set off by its receptor cells do. This unit measures how small a difference a person can notice, separates what a person can sense from what they are willing to report, follows light from the retina to the cortex, and uses the classic illusions, the cross-cultural data, and the dress photograph of 2015 to show that perception is a well-informed inference rather than a copy of the image.
The world never reaches the brain. What reaches it is a stream of nerve impulses set off by a few hundred million receptor cells, most of them in the two retinas, each of which reports one thing, such as the amount of light falling on one spot of the retina. From this stream the brain builds the scene that seems to be simply there, with its colours, its distances, and its familiar objects. This unit follows the stream from the stimulus to the experience, from how small a difference a person can notice to why two lines of equal length can look unequal, and it ends with the evidence that perception is less a recording than a well-informed guess.
1 Sensation and the measurement of experience
Psychologists separate two steps. Sensation is the detection of a physical stimulus by a receptor and its conversion into a nerve signal, and perception is the organization and interpretation of those signals into an experience of objects and events. The border between the two is not sharp, but the distinction keeps a question clear: when a person fails to see something, the failure can lie in the receptors, which did not register the light, or in the interpretation, which registered it and discarded it, and the closing section of this unit shows how often the second happens.
Every sense begins with transduction, the conversion of one form of energy into another. A photoreceptor in the eye turns light into a change of membrane voltage, a hair cell in the ear turns a vibration into one, and a receptor in the tongue turns a dissolved molecule into one; everything from the receptor onwards uses the membrane and the action potential of Unit 2. The receptor is tuned to one kind of energy, and this tuning decides what a species can sense. A human eye registers light between about \(400\) and \(700\unit{nm}\) of wavelength, and ultraviolet light, which a honeybee sees, does not exist for us because no receptor reports it.
1.1 Thresholds
The oldest question of the field is how weak a stimulus can be and still be sensed. The absolute threshold is the smallest intensity of a stimulus that a person detects on half of the occasions on which it is presented. The “half” is deliberate, because near the limit the same faint light is seen on some presentations and missed on others. The receptors and the nerves are noisy, so there is no sharp intensity below which nothing is seen. The curve that gives the proportion of detections against intensity is called a psychometric function; it rises smoothly from zero to one, and the intensity at which it crosses one half is the threshold.
The absolute thresholds of the human senses are remarkably low. In 1942 Selig Hecht (1892-1947) and his colleagues Simon Shlaer and Maurice Pirenne measured how little light a person who had sat in the dark for half an hour could still see, and found that a flash of between 54 and 148 photons, the smallest packets in which light comes, arriving at the front of the eye was seen on half of the presentations. After subtracting the light reflected by the cornea, absorbed on the way through the eye, or passed through the retina without being caught, they concluded that only 5 to 14 photons had been absorbed, spread over several hundred of the retina’s receptor cells for dim light, the rods, which Section 3 describes, so that a single rod must respond to a single photon. Later recordings from individual rods confirmed this, and a receptor cannot be more sensitive, because light does not come in smaller portions.
The second kind of threshold concerns differences. The difference threshold, also called the just noticeable difference, is the smallest change in a stimulus that a person notices, again on half of the occasions. In 1834 the physiologist Ernst Heinrich Weber (1795-1878) in Leipzig asked people to lift two weights in turn and say which was heavier, and he found that the difference they could just notice was a fixed fraction of the weight rather than a fixed number of grams. A person who can just tell 40 grams from 41 can also just tell 400 from 410, and the fraction, about one part in forty for weights lifted by hand, is the same across the range. This was the first quantitative law of psychology.
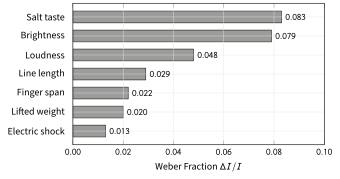
Figure 1 shows the Weber fractions of seven senses as compiled by Robert Teghtsoonian in 1971 from the published thresholds of the time, and the spread is large, from about 1% for the strength of an electric shock to about 8% for brightness and for the saltiness of a solution.
1.2 Fechner’s law and the logarithm
Gustav Theodor Fechner (1801-1887), a physicist in Leipzig and Weber’s younger colleague, saw that Weber’s law gives a way to measure sensation itself, which nobody had thought possible. His argument is in the box below, and because it uses the logarithm, which several later units need, the logarithm is explained there as well.
The weak point of the argument is its first assumption. Nothing guarantees that every just noticeable difference feels like the same size of step, and Stanley Smith Stevens (1906-1973) at Harvard showed in the 1950s that it does not. When people assign numbers to the loudness of sounds or the brightness of lights, so that a sound that seems twice as loud gets twice the number, the numbers follow a power of the intensity rather than its logarithm. The two laws are now read as descriptions of different tasks: Fechner’s law describes discrimination, the telling apart of two stimuli, and Stevens’s law describes judgement, the giving of a number to one stimulus. The exponents in the Principles box say what each sense does with a difference: a sound must be increased a great deal in pressure to seem twice as loud, whereas a small increase in current is felt as a large increase in pain, which is useful when the stimulus can do harm.
2 Signal detection
A threshold experiment has a weakness that Fechner’s methods cannot remove. When a person is asked whether a faint light was shown, the answer depends on the sensitivity of the eye and also on how willing the person is to say “yes” when unsure, so a cautious observer and a bold observer with the same eyes report different thresholds. Signal detection theory, developed in the 1950s for radar operators and brought into psychology by John Swets, David Green, and Wilson Tanner, separates the two.
The theory describes a trial, which here means one presentation on which a signal is either present or absent, as follows. The observer receives some amount of internal evidence, which varies from trial to trial because the receptors and the brain are noisy. Without the signal the evidence is noise alone, scattered around a low average value, and with the signal the same scatter is shifted upwards by the amount that the signal adds; the two bell-shaped curves of Figure 2 show these two distributions of evidence. The observer sets a criterion, a level of evidence above which the answer is “yes”. Four outcomes are then possible, and two of them carry all the information:
- a hit, in which the signal is present and the observer says “yes”, with the hit rate \(H\) being the proportion of signal trials answered “yes”;
- a false alarm, in which the signal is absent and the observer says “yes”, with the false alarm rate \(F\) being the proportion of noise trials answered “yes”;
- a miss, in which the signal is present and the answer is “no”;
- a correct rejection, in which the signal is absent and the answer is “no”.
The miss rate is \(1 - H\) and the correct rejection rate is \(1 - F\), so the hit rate and the false alarm rate describe everything. Figure 2 shows the two distributions and the criterion. Moving the criterion to the left in the figure, towards lower evidence, makes the observer say “yes” more often, which raises the hit rate and the false alarm rate together, and moving it to the right, towards higher evidence, lowers both; what the criterion cannot change is the distance between the two distributions, which is the observer’s sensitivity.
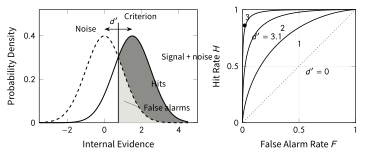
An observer who says “yes” at random has \(H = F\) and \(d' = 0\), whatever the criterion; \(d' = 1\) gives about 69% correct answers at best, and \(d' = 3\) about 93%. If the criterion is moved through all its positions and the hit rate is plotted against the false alarm rate, the result is the receiver operating characteristic, or ROC, drawn in the right panel of Figure 2; every point on one curve belongs to the same sensitivity and a different criterion. The same analysis serves wherever a decision is made under uncertainty, for a radiologist reading a scan, for a witness at a line-up, and for a memory test, which is the example worked next.
3 The eye and the visual brain
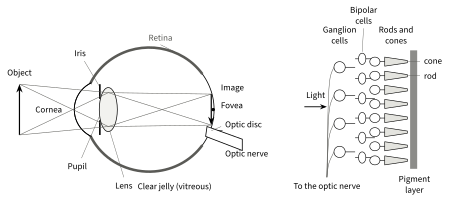
Vision is the sense that psychology knows best, and the rest of this unit uses it as the main example. Figure 3 shows the eye in section. Light enters through the cornea, the clear front window, which does most of the focusing, and passes through the pupil, the opening in the coloured iris that changes its diameter between about \(2\) and \(8\unit{mm}\) to regulate the light. Behind it the lens adjusts the focus for near and far objects by changing its shape, and the light crosses the clear jelly of the eyeball to land on the retina, the layer of nerve tissue that lines the back of the eye, as an image that is upside down and reversed. This bothers nobody, since the brain has never known the image any other way.
3.1 The retina
In the embryo the retina grows out of the brain, so it is a piece of the brain that has moved to the front of the head, and it contains two kinds of photoreceptors. The rods, about 90 to 120 million of them, respond to a single photon, as Hecht’s experiment showed, and serve vision in dim light, but they do not distinguish colours and are absent from the centre of the retina. The cones, about 4.5 to 6.5 million, need more light, come in three types that respond to different wavelengths, and provide sharp and coloured vision in daylight. The counts come from studies of human retinas by Gustav Østerberg (1935) and Christine Curcio and colleagues (1990); the ranges span the two studies and the real differences between people, since Curcio’s eight retinas alone ran from 78 to 107 million rods.
The cones are packed most densely in the fovea, a pit about \(1.5\unit{mm}\) across at the centre of the retina that receives the central 5 degrees or so of the visual field. Its floor, the foveola, is only about \(0.35\unit{mm}\) wide, holds cones and no rods, and receives the central one to two degrees, about the width of a thumbnail at arm’s length. Only the fovea sees sharply, and only its centre sees sharpest; the letters of this sentence are resolved by the fovea alone, and everything a few degrees from the point of gaze is seen in far less detail than it seems. The impression of a sharp world comes from eye movements called saccades, jumps from one point of interest to the next about three to four times every second, by which the fovea samples the scene piece by piece while the brain keeps a stable picture.
The photoreceptors do not send their signals to the brain directly. They pass them to bipolar cells, which pass them to ganglion cells, whose axons, about one million per eye, run across the surface of the retina and leave the eye together as the optic nerve. Where they leave the eye there is no room for receptors, and this optic disc produces the blind spot, a region of the visual field about \(5\) to \(6\) degrees wide and \(7\) to \(8\) degrees high, about \(15\) degrees to the outer side of the point of gaze in each eye. The full Moon is half a degree across, so the blind spot could hide 10 to 12 full Moons placed side by side. The French physicist Edme Mariotte (about 1620-1684) discovered it in the 1660s. Nobody notices it in daily life because the other eye covers the same region and because the brain fills the gap with whatever surrounds it, the first of several facts in this unit that show how much of perception is constructed rather than recorded.
The two kinds of receptor explain dark adaptation, the slow recovery of sensitivity in the dark. The cones adapt within a few minutes and then stop improving, while the rods go on improving for 30 to 40 minutes and overtake the cones after about 7 to 10 minutes, so that the threshold drops in two stages, and a night sky that showed only a few stars at first shows thousands half an hour later. Because the rods do not serve the fovea, a faint star is seen best by looking slightly to one side of it.
3.2 From the retina to the cortex
Figure 4 follows the optic nerves into the brain. At the optic chiasm the fibres from the inner half of each retina cross to the other side, while those from the outer half stay on their own side. Because the image on the retina is reversed left to right, the inner half of the left retina and the outer half of the right retina both look at the right half of the world, and so the crossing sorts the fibres by visual field rather than by eye, so that everything to the right of the point of gaze is sent to the left hemisphere and everything to the left to the right hemisphere. After the chiasm the fibres end in the lateral geniculate nucleus of the thalamus, the relay station of Unit 2, and from there a broad band of fibres runs to the primary visual cortex, also called V1, on the inner surface of the occipital lobe. V1 holds a map of the visual field in which the fovea gets a share of the cortex far larger than its share of the retina, and its neurons respond to small oriented edges rather than to whole objects, as David Hubel and Torsten Wiesel found in the cat in 1959.
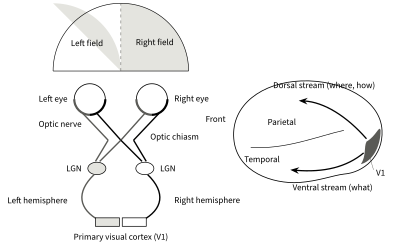
From V1 the processing fans out into dozens of further areas along two broad routes. The ventral stream runs downwards into the temporal lobe and is concerned with what things are, such as their shape, colour, and identity, and the dorsal stream runs upwards into the parietal lobe and is concerned with where things are and how to act on them. The clearest evidence for the division comes from a single patient. Patient D.F. suffered carbon monoxide poisoning in 1988 that damaged her ventral stream on both sides. She could no longer recognize objects or drawings and could not say or show with her hand whether a slot in front of her was horizontal, vertical, or tilted, yet when Melvyn Goodale and David Milner asked her to put a card through the slot, as if posting a letter, she turned her hand to the correct angle and posted it without difficulty (Goodale et al. 1991). The intact dorsal stream still used the orientation of the slot to guide her hand, while the damaged ventral stream could no longer bring it into her awareness.
3.3 Colour
Colour is not a property of light. Light has wavelengths, and colour is what the visual system makes of them. In 1802 Thomas Young (1773-1829) proposed that the eye needs only three kinds of receptor to see every colour, and measurements of the pigment in single human cones, first made in 1964 and refined by James Bowmaker and Herbert Dartnall in 1980, confirmed three cone types, with peak sensitivities near \(420\unit{nm}\) (blue-violet), \(534\unit{nm}\) (green), and \(563\unit{nm}\) (yellow-green). This is the trichromatic theory. Every colour corresponds to one pattern of activity in the three cone types, and the theory explains colour blindness: about 8% of men and 0.4% of women of European ancestry lack one of the two longer-wavelength cone types or have a shifted version of it, so that red and green produce nearly the same pattern for them.
Three cones do not explain everything. Nobody sees a reddish green or a yellowish blue, and after staring at a red patch for half a minute a white wall shows a green afterimage. Ewald Hering (1834-1918) proposed from 1878 onwards that colour is coded in three opposing pairs, red against green, blue against yellow, and black against white, and recordings in the 1950s and 1960s found exactly such opponent cells in the retina and the lateral geniculate nucleus, excited by one colour of a pair and inhibited by the other. Both observations follow from the pairs. A cell that signals red by firing more and green by firing less cannot signal both at once, which is why there is no reddish green, and after half a minute of red its response tires, so that a white wall, which would normally leave it at rest, now drives it towards green. Both theories are right at different stages: the cones are trichromatic, and the cells after them are opponent.
The last ingredient is colour constancy. A white page looks white under the yellowish light of a bulb and under the bluish light of a cloudy sky, although the light it sends to the eye differs in the two cases, because the visual system estimates the colour of the illumination from the whole scene and discounts it. The correction is usually invisible, and Section 6 shows what happens when two people’s visual systems make different estimates of the light.
4 Hearing and the other senses
Sound is a vibration of the air, and two properties of the vibration matter to hearing. Its frequency, measured in hertz, is the number of pressure cycles per second and is heard as pitch; a young adult hears from about \(20\unit{Hz}\) to \(20\unit{kHz}\), and the upper limit falls with age. Its amplitude, the size of the pressure swing, is heard as loudness and is measured on the decibel scale, which is logarithmic in the sense of Fechner’s law: sound pressure level, written dB SPL, is \(20\log(p/p_0)\), where \(p_0 = 20\unit{\mu Pa}\), twenty millionths of a pascal, is a reference close to the absolute threshold of hearing. Since \(\log 10 = 1\), every \(20\unit{dB}\) is a factor of ten in pressure, so a quiet conversation at \(60\unit{dB}\) is a thousand times the threshold pressure and a rock concert at \(120\unit{dB}\) a million times.
The ear turns this vibration into nerve signals in three stages. The outer ear funnels the sound to the eardrum, and the three small bones of the middle ear pass its vibration on, like a system of levers, to the much smaller oval window of the inner ear. Behind that window lies the cochlea, a fluid-filled tube coiled like a snail shell, and inside it the vibration travels along the basilar membrane, a strip about \(35\unit{mm}\) long that carries about 3,500 inner hair cells, which do almost all the signalling to the brain, and about 12,000 outer hair cells, which amplify the vibration. The membrane is narrow and stiff at its base and wide and flexible at its far end, so a vibration travels along it as a wave that grows until it reaches the place tuned to its frequency and dies away just beyond it, with high tones peaking near the base and low tones near the tip. Georg von Békésy (1899-1972) observed this travelling wave in cochleas from cadavers and received the Nobel Prize for it in 1961.
The place of the wave is the first of two codes for frequency. Where the membrane moves most, the hair cells on it are bent most, and bending opens ion channels in their hairs and makes them signal by the mechanism of Unit 2, so which hair cells fire tells the brain the frequency of the sound, which is called place coding. For frequencies up to a few thousand hertz the nerve fibres also fire in step with the vibration, so that the timing of the impulses carries the frequency as well, which is called temporal coding; no single fibre can fire \(1000\) times per second, but a group of fibres can, each firing on some of the cycles. A cochlear implant uses place coding to repair the deafness that follows the loss of hair cells, by stimulating the nerve at the places that correspond to the frequencies of the sound.
The other senses follow the same plan of receptor, transduction, and pathway. Touch uses several kinds of receptor in the skin for pressure, vibration, stretch, and temperature, and their density decides the sharpness of the sense, so that the two points of a drawing compass, pressed on the skin at the same time, can be told apart at a few millimetres on a fingertip but need several centimetres on the back. Pain has its own receptors and pathways and is the sense most open to modification by the brain, since fear, attention, and expectation all change how much an injury hurts. Taste and smell are chemical senses; the tongue has receptors for five qualities, sweet, salty, sour, bitter, and umami (the savoury taste of broth), the nose has several hundred kinds of receptor, and most of what is called the taste of food is in fact smell, as a blocked nose demonstrates.
5 Perceptual organization
The retina delivers a mosaic of millions of points of light, and the first job of perception is to decide which of them belong together. In 1923 Max Wertheimer (1880-1943), the founder of Gestalt psychology, described the rules by which the visual system groups points into objects. The German word Gestalt means a shape or a whole, and the school’s central claim, that the whole is perceived before its parts rather than assembled from them, is confirmed by every illusion in the rest of this unit.
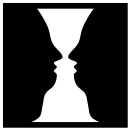
A second decision is which part of the image is the object and which the background. The Danish psychologist Edgar Rubin (1886-1951) studied this figure-ground organization in his thesis of 1915 with the picture that still bears his name, a white vase on a black ground that can equally be seen as two black faces in profile (Figure 5). The border between the two regions is assigned to one of them, which becomes the figure, and the other becomes a shapeless ground that seems to continue behind it. The two readings cannot be held at the same time, and the picture flips between them every few seconds, which shows that the organization is a decision of the visual system rather than a property of the ink.
5.1 Depth
The retina is a two-dimensional surface, and depth has to be inferred from cues. The strongest cue at short range is binocular disparity. The two eyes are about \(6.5\unit{cm}\) apart and see the world from slightly different positions, so an object nearer or farther than the point of fixation, the point at which both eyes are aimed, falls on slightly different places in the two retinas, and the brain reads the difference as depth. Charles Wheatstone (1802-1875) demonstrated this in 1838 with the stereoscope, which shows each eye a drawing made from its own viewpoint and produces a vivid impression of depth from two flat pictures, the trick that three-dimensional films still use.
Binocular disparity fails beyond a few tens of metres, where the two views become identical, and a person with one eye still sees depth, so there must be cues that work in one eye, and the painters of the Renaissance knew them all:
- an object that hides part of another is nearer;
- parallel lines such as the edges of a road converge towards the horizon, which is linear perspective;
- the texture of a surface becomes finer with distance;
- distant objects are bluer and paler;
- of two objects known to be the same size, the one with the smaller retinal image is farther away, which is the cue that size constancy relies on.
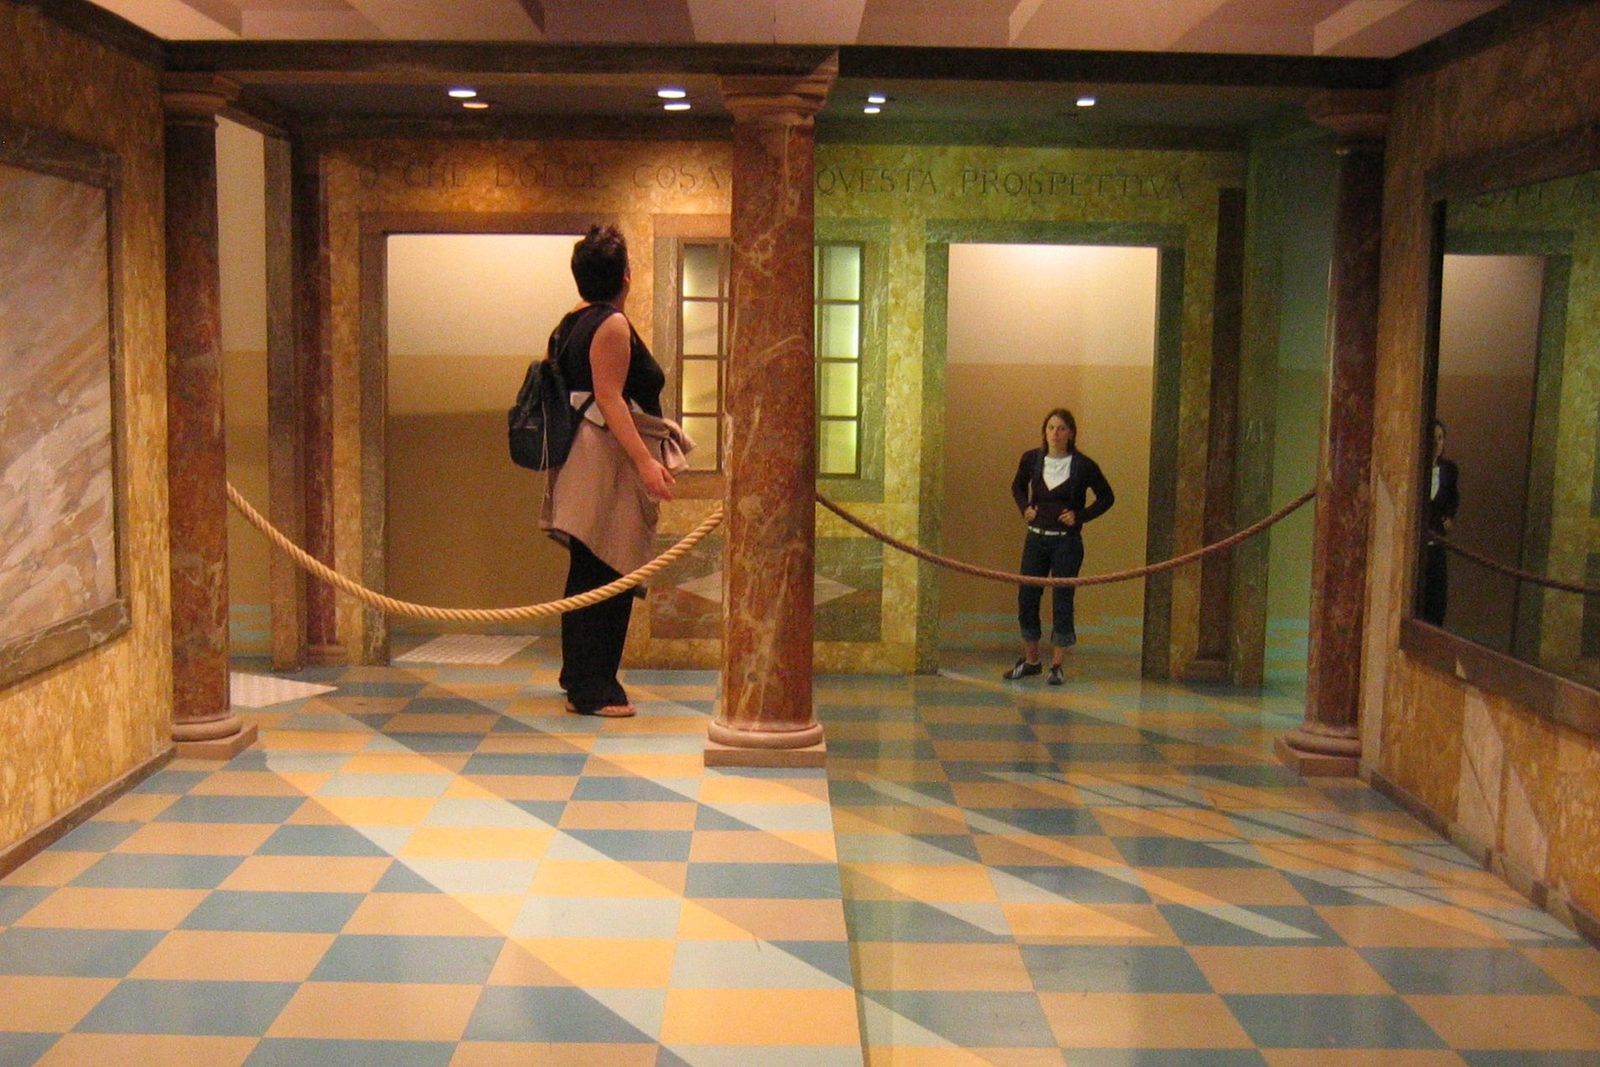
Size constancy works in both directions, and that is where it can go wrong. If the visual system takes an object to be farther away than it is, it enlarges the perceived size to match, and a small retinal image is then seen as a large object. The Ames room, which the American scientist Adelbert Ames Jr. (1880-1955) designed in the 1930s and filed a patent for in 1940, exploits this. One far corner of the room is twice as far from the viewer as the other, and its walls, floor, and windows are drawn in false perspective so that, through a peephole that fixes the viewing position and removes the cues of the second eye, the room looks rectangular. Two people of the same height in the two far corners then look like a giant and a dwarf (Figure 6), because the visual system assumes equal distances and attributes the twofold difference in image size to the people instead. The moon illusion is the same effect at the scale of the sky. The Moon near the horizon looks larger than the Moon high in the sky, although photographs show the same half degree in both positions, and Lloyd Kaufman and Irvin Rock showed in 1962 that the horizon, with its cues of distance, makes the visual system register the Moon as farther away, so that the same retinal image is perceived as larger. Kaufman and his son confirmed this in 2000 with an artificial moon whose apparent distance could be set. One puzzle remains, because when people are asked outright, many nevertheless call the horizon Moon the nearer one, and the account has never fully settled this paradox.
6 Perception as inference
The blind spot that is filled in, the colour that is corrected for the light, the size that is corrected for the distance, and the Ames room that defeats the correction all point to the same conclusion. Perception does not copy the image on the retina; it infers, from that image and from what the visual system has learned about the world, the scene that most probably produced the image. Hermann von Helmholtz (1821-1894) called this unconscious inference in 1867, and the modern form of the idea, which treats the inference as a calculation of probabilities, goes beyond this unit. The evidence comes mainly from the cases in which the inference goes wrong, which are the visual illusions.
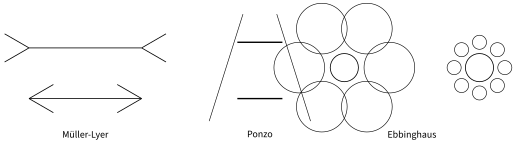
Figure 7 shows three of them. In the Müller-Lyer illusion, described by Franz Carl Müller-Lyer (1857-1916) in 1889, a line with outward fins (the upper line in the figure) looks longer than a line of the same length with inward fins (the lower line). In the Ponzo illusion, named after the Italian psychologist Mario Ponzo (1882-1960), two equal bars drawn between converging lines look unequal, and the upper one looks larger. In the Ebbinghaus illusion, which Hermann Ebbinghaus devised and Edward Titchener popularized in a textbook of 1901, a circle surrounded by large circles looks smaller than an identical circle surrounded by small ones. A ruler settles each case in a second, and the illusion survives the measurement. Knowing that the lines are equal does not make them look equal.
The explanation that Richard Gregory proposed in the 1960s treats the first two illusions as size constancy applied to a drawing. The converging lines of the Ponzo figure are the cue of linear perspective, so the upper bar is taken to be farther away, and a bar that is farther away with the same retinal size must be larger. The Müller-Lyer fins resemble corners, the inward fins like the outside corner of a building, which is nearer than its edges, and the outward fins like the inside corner of a room, which is farther away than its edges. Whether this is the whole explanation is still argued, and the Ebbinghaus illusion needs an account in terms of the contrast between a circle and its neighbours, but all three show the same thing: the visual system applies rules that serve it well in a three-dimensional world, and a drawing that triggers the rules without the world behind them exposes them.
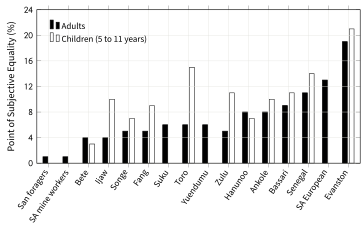
The size of the illusion can be measured. In the study described below, participants were shown a series of Müller-Lyer figures in which the shaft with outward fins was drawn at a range of lengths relative to the shaft with inward fins and asked on each figure which shaft was longer, and the point at which the answers switched gave the point of subjective equality, the length ratio at which the two shafts looked equal. The illusion is then expressed as the percentage by which the shaft with inward fins had to be made longer before the two looked equal. The interactive element below measures the reader’s own point of subjective equality in the same way.
If perception is inference from learned rules, then people who learned different rules should see differently, and this was the idea behind the largest study of illusions ever made. Marshall Segall, Donald Campbell, and the anthropologist Melville Herskovits had the Müller-Lyer figure and four other illusions shown to adults and children in 17 samples across Africa, the Philippines, Australia, and the United States, with the first results in Science in 1963 and the full report in their book of 1966; Figure 8 shows the Müller-Lyer results for 16 of them.
Two further illusions show the inference at work on brightness and on shape. In the checker-shadow illusion published by Edward Adelson in 1995, a light square inside the shadow of a cylinder and a dark square outside it are printed in the same grey, yet the square in the shadow looks much lighter, because the visual system discounts the shadow as colour constancy discounts the illumination; and in the hollow mask illusion described by Richard Gregory, the inside of a face mask is seen as a normal convex face even by observers who know it is hollow, because the rule that faces bulge outwards overrides the cues of shading and of binocular disparity. On 26 February 2015 the inference became a public event.
7 Attention and change blindness
The inference of the previous section has a cost. If the brain keeps a description of the world instead of the image, then much of the image is never examined, and changes in it can pass unnoticed. In 1997 Ronald Rensink, Kevin O’Regan, and James Clark showed people a photograph that alternated with a slightly altered version of itself, with a blank grey screen flashed between the two. The change could be as large as a jet engine disappearing from the wing of an aircraft, and yet observers often needed tens of seconds to find it, because the blank screen hid the flicker that would otherwise have drawn the eye to the spot. The phenomenon was named change blindness, the failure to notice a change in a scene when the change is not marked by a visible motion.
The most striking demonstration left the laboratory. Daniel Simons and Daniel Levin (1998) had an experimenter stop a pedestrian on a university campus and ask for directions. While they talked, two men carrying a door walked between them, and behind the door the experimenter was replaced by a second experimenter with different clothes, a different voice, and a different build. Of the 15 pedestrians, only 7 noticed that they were now talking to a different person, and in a second experiment, in which the experimenters dressed as construction workers so that the students they stopped would see them as members of another group, only 4 of 12 noticed. The pedestrians who missed the switch had attended closely enough to give directions, but what they had kept of the person in front of them was a description, such as a man with a map asking the way, and the description survived the swap.
Change blindness is not a defect of the eye; the retinas of the pedestrians registered both experimenters. It is a consequence of attention, the process that selects a part of the available information for detailed processing and leaves the rest as a rough sketch, so that only what is attended is encoded in enough detail to be compared with what comes after. Attention as a system, including the experiment in which half of the observers counting basketball passes fail to see a person in a gorilla suit walk through the game, belongs to Unit 6. For this unit the lesson is the one that runs from the first page to the last: the world as perceived is a construction, built from millions of noisy measurements by a system that knows what the world is usually like, and the construction is so good that it takes a laboratory, an illusion, or a photograph of a dress to notice that it is one.