 Image: Fibonacci, CC BY-SA 3.0, via Wikimedia Commons
Why two equal lines look unequal
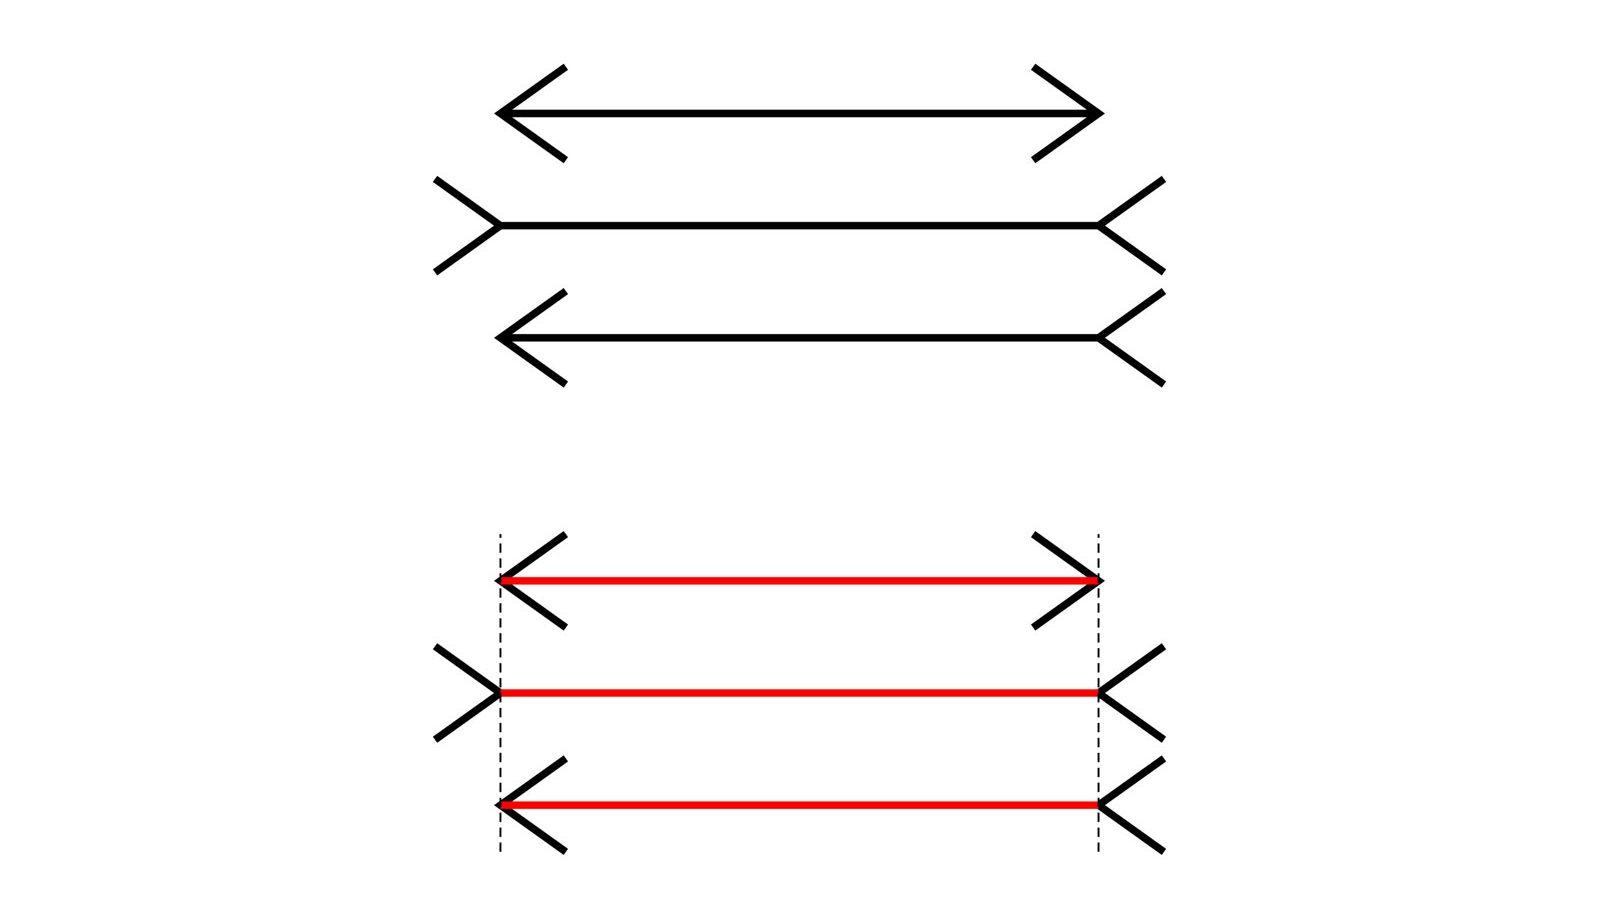
Two horizontal lines of the same length, one with arrowheads pointing outwards at its ends and one with arrowheads pointing inwards. The line with the inward-pointing fins looks longer. A ruler says they are equal, and the ruler does not help: once you put it away the line looks longer again. The German psychiatrist Franz Carl Müller-Lyer published the figure in 1889, and it has been in every introduction to perception since.
The illusion is useful to psychologists for the same reason it is irritating to everyone else. Knowing the truth does not remove it, so whatever produces it runs before beliefs get a say, and the figure is a way of studying that process from the outside.
How large the illusion is
The effect can be measured. Show someone the figure with the fins and ask them to adjust a plain line until it looks the same length. The difference between the adjusted line and the real length, as a percentage, is the size of the illusion. For an adult looking at the standard figure with fins at about 45 degrees, the shaft with inward fins has to be made shorter by somewhere between 10% and 25% before the two look equal. The exact figure depends on the angle and the length of the fins, on whether the two shafts are shown side by side or one above the other, and on the person.
Two facts about this measurement matter. The illusion shrinks with repeated viewing, by a few percentage points over a session, which is why experiments measure it on fresh participants. And it is present in touch as well as sight: blindfolded people who feel the figure as raised lines make the same error. Whatever the explanation is, it cannot be only about the eye.
The 1966 study across cultures
In the late 1950s, Marshall Segall, Donald Campbell, and Melville Herskovits sent the figure, together with other illusions, to anthropologists working in more than a dozen communities in Africa, the Philippines, and the United States. The results, published in 1966 as The Influence of Culture on Visual Perception, came from about 1,900 people. The Müller-Lyer illusion was strongest in the American and European samples and weakest among people living in open country in the Kalahari and in parts of rural Africa, who were affected by it only a little.
The authors' explanation was the carpentered-world hypothesis. Someone who grows up among rectangular rooms and buildings sees thousands of corners every day. An inside corner of a room, seen from the middle of the room, projects onto the retina as a vertical line with fins pointing outwards; the outside corner of a building projects as a line with fins pointing inwards. A person who has learnt to read fins as corners also reads them as depth, and a line that appears farther away but produces the same retinal image must be longer. People who grow up among round huts and open horizons have had less of this training.
The hypothesis fits the 1966 data, and it still has supporters. It also has problems. The illusion appears in young children at close to its adult size, and it has been found in several animals, including pigeons, parrots, and fish, which have not spent their lives in buildings. Later studies found that schooling and familiarity with pictures account for part of the difference between groups, and the size of the effect varies with how the figure is drawn and with the age and schooling of the participants. The cross-cultural difference is real; what causes it is still argued about.
Two explanations that compete
The explanation Richard Gregory proposed in the 1960s is inappropriate constancy scaling, which is the carpentered-world idea stated as a mechanism. The visual system corrects the size of things for their distance all the time, which is why a person walking away from you does not seem to shrink. The fins are depth cues, the correction is applied to a flat figure where it does not belong, and the line that is read as farther away is scaled up. The theory predicts that the illusion should be strongest where the fins look most like a corner, and in general it is. It also predicts that the illusion should disappear in people who cannot see depth cues, and it does not, which is one of the reasons it is no longer accepted as the whole story.
A second line of explanation comes from the statistics of natural scenes. In 2005, Catherine Howe and Dale Purves measured, in a large set of photographs of real scenes analysed with a laser range finder, how long the real objects were that produce a line with outward fins on the retina and how long the ones that produce a line with inward fins. On average, the sources of inward-fin images were longer. If the visual system has been tuned by experience, or by evolution, to see each image as the object that most often produced it, then the illusion is the correct answer to the wrong question. The paper is free to read at PNAS.
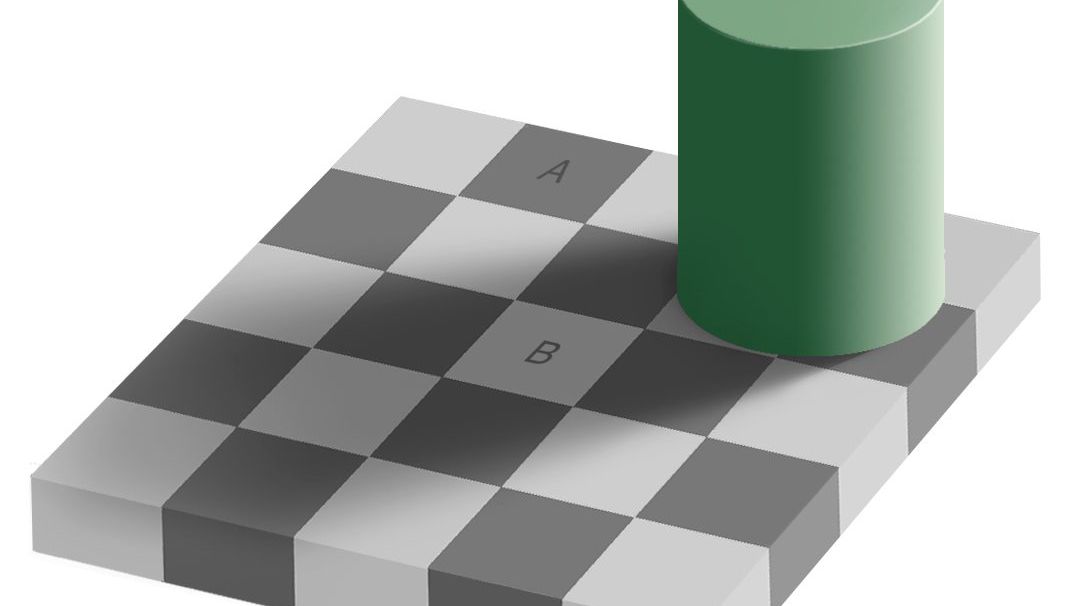
Both accounts say that perception is a guess about the world rather than a copy of the image, and they disagree only about where the guess comes from. That is the view of perception that the illusions in Unit 3 of the masterclass are used to teach, with the checker-shadow figure, the Ames room, and the dress as further evidence.
Measure your own
The vision scientist Michael Bach keeps a collection of interactive illusions on his website, with references for each. On the Müller-Lyer page you drag a slider until the two shafts look equal and then read off the percentage by which they differ. Three things to try:
- Measure yourself five times and take the mean. Your five values will differ by a few percentage points, which is the measurement noise that every perception experiment has to average out.
- Change the fin angle. The illusion grows as the fins close towards the shaft and fades as they open towards a straight line.
- Test a friend who has never seen the figure, then test yourself again. First-time viewers usually show a larger effect.
A classroom of thirty people measured this way gives a distribution with a mean, a standard deviation, and a few outliers, which is exactly the kind of data the first unit of the masterclass teaches you to describe. A school project comparing the illusion in two age groups, or in people who do and do not draw, is a replication of a classic study and can be done in an afternoon.
Why it matters beyond the figure
The Müller-Lyer figure is a small thing. What it shows is not. Every perceptual system is built on assumptions about the world it usually meets, and the assumptions are invisible until a stimulus breaks them. A line with fins breaks one assumption about corners and distance. The dress of 2015 broke one about the colour of daylight. An illusion is the visible edge of a rule by which the system works, and those rules are what a psychologist wants to know.