
Research methods and replication
How to read a p-value and an effect size, what happened when 100 experiments were repeated, the practices behind false findings, and what changed since 2011.
Articles
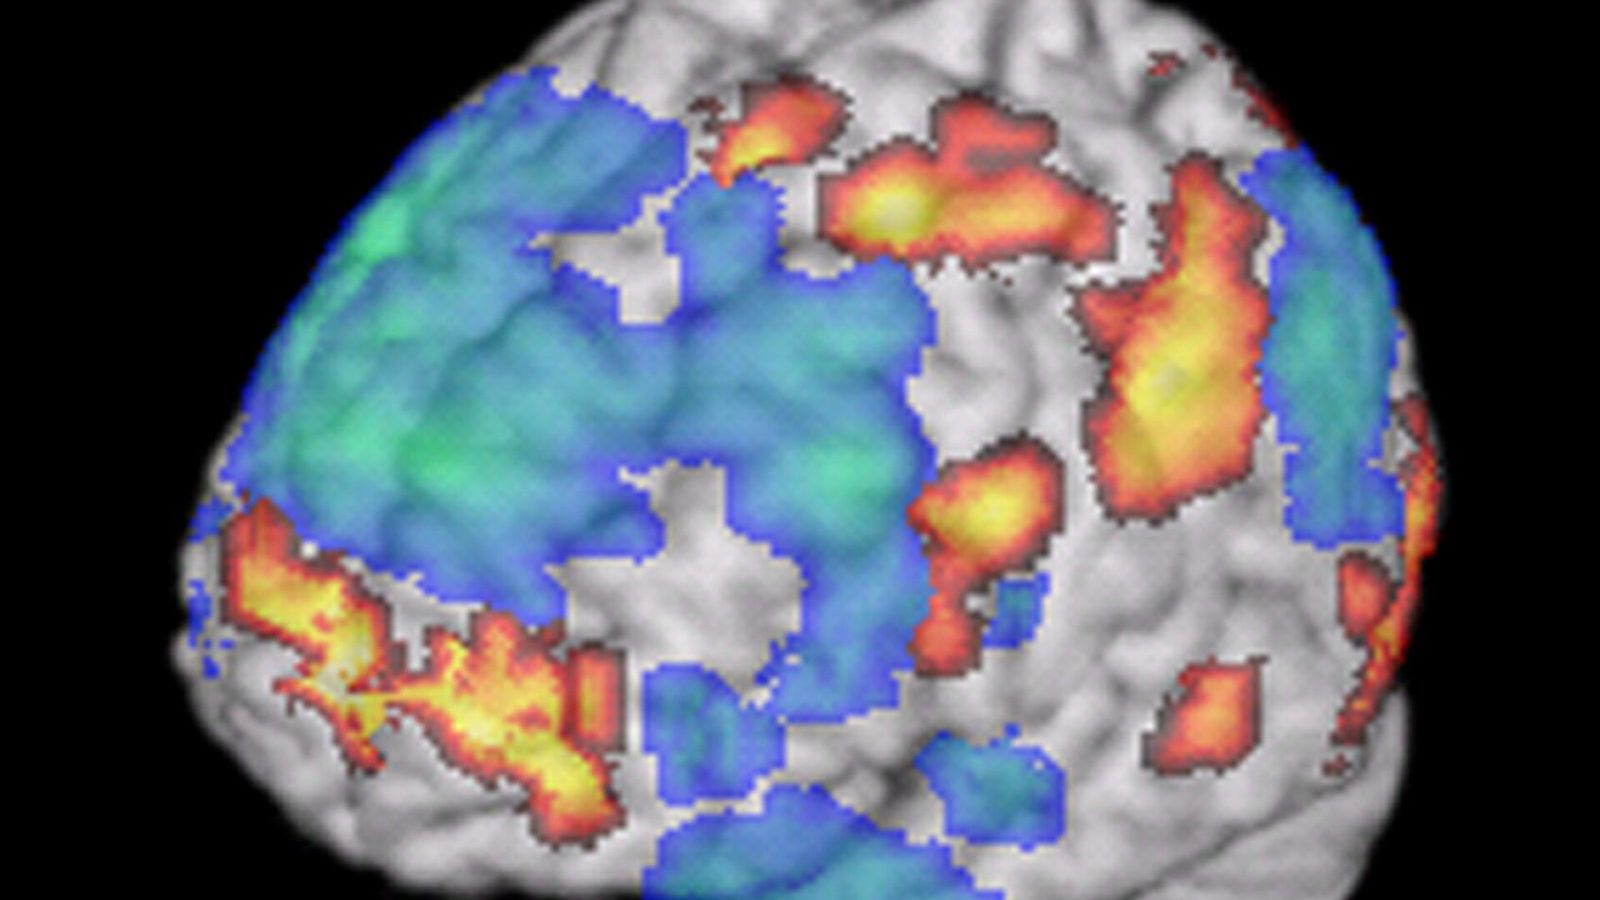
What an fMRI scan actually measures
A coloured blob on a grey brain looks like a photograph of thinking. It is a map of where a statistical test passed, computed from changes in blood oxygen several seconds after the neurons fired. Here is what the signal is, what the dead salmon showed, and how to read a brain image in the news.

The Stanford prison experiment in the archives
For nearly fifty years the Stanford prison experiment was taught as proof that a uniform and a role can turn anyone cruel. Then researchers read the archive. What they found about the coaching of the guards has changed how the study is taught.
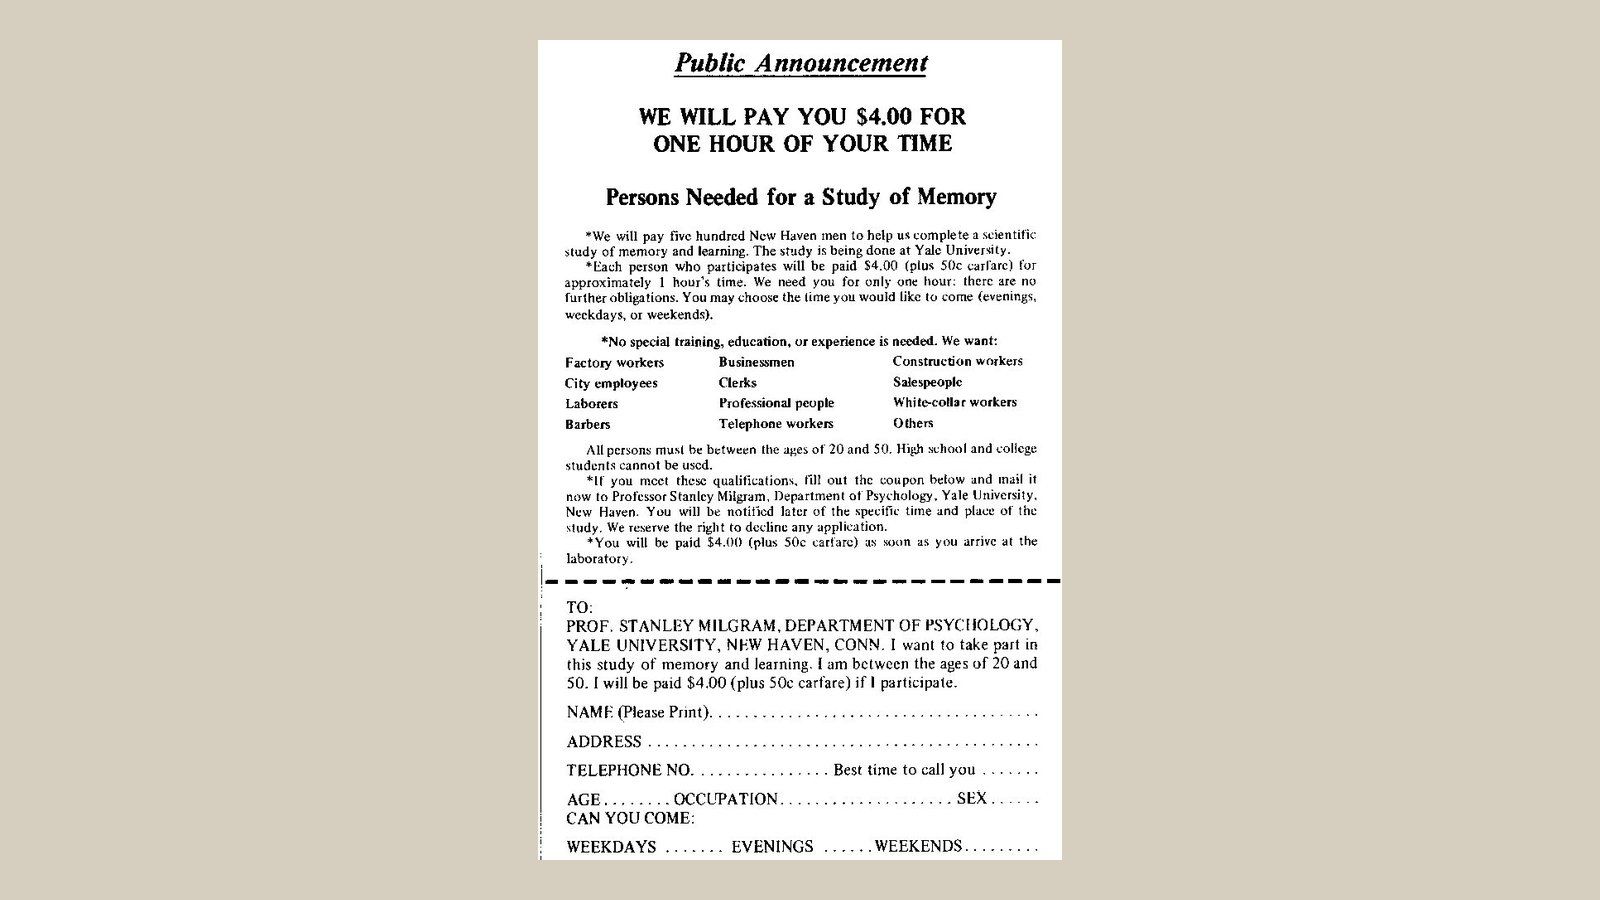
Milgram's obedience study, sixty years on
In 1963 Stanley Milgram reported that 26 of 40 ordinary men had given what they believed were 450-volt shocks to a stranger because a man in a grey coat told them to. Here are the figures, the variations, the ethics debate, the 2009 replication, and what the archives changed.

How to read a p-value
Every psychology paper reports p-values, most news stories misread them, and so do many of the scientists who compute them. Here is what p below 0.05 means, three things it does not mean, and why the effect size matters more.

What happened when psychologists repeated 100 experiments
In 2015, 270 researchers repeated 100 published studies from three leading journals. About a third gave a significant result again. Here are the figures, what produced them, and what psychology has changed in the ten years since.