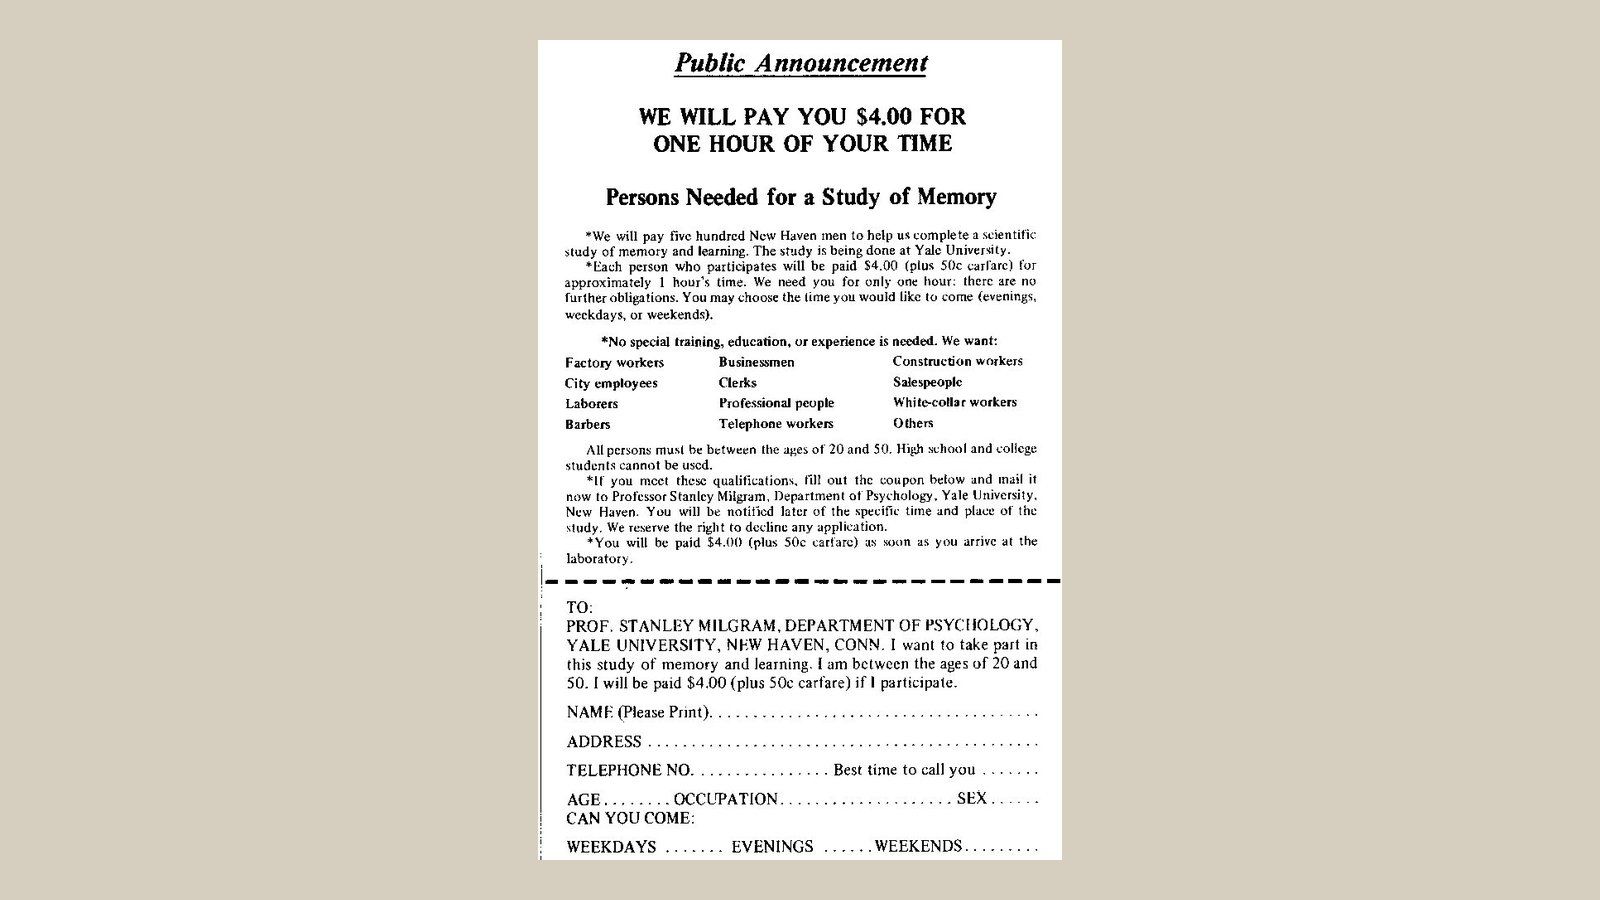
 Image: Filip Romanski, CC BY-SA 3.0, via Wikimedia Commons
How to read a p-value
A study gives one group of students a new way of revising and another group the old way, and the first group scores 3 points higher on the test. Is 3 points a real difference or the kind of gap that two groups of twenty people would show anyway? That is the question a p-value answers, and it answers only that question. Most of the trouble with p-values comes from asking them something else.
What the number is
Start with the assumption that the new method does nothing. Call it the null hypothesis. If it is true, the two groups are two samples from the same population, and the difference between their means is produced by which students happened to land in which group. Sometimes the difference will be small and sometimes, by chance, large. Statistics can calculate, from the size of the groups and the spread of the scores, how often chance alone would produce a difference at least as large as the one observed. That probability is the p-value.
So p = 0.03 means: if the method had no effect, a difference this large or larger would turn up in about 3 of every 100 repetitions of the study. By a convention that goes back to Ronald Fisher in the 1920s, a p below 0.05 is called statistically significant, and the convention is only a convention. There is nothing in nature at 0.05. Fisher himself treated it as a rough guide, and a result at 0.049 is not evidence of a different kind from one at 0.051.
Three things it does not mean
It is not the probability that the null hypothesis is true. The p-value is calculated by assuming the null hypothesis and asking how surprising the data would be. It cannot then turn round and tell you the probability of the thing it assumed. To get from "how likely are these data if there is no effect" to "how likely is there an effect given these data" you need Bayes' theorem and a prior, which is to say some idea of how plausible the effect was before the study ran. A p of 0.03 for a plausible effect in a large study is strong evidence; the same p for an implausible effect in a small study, such as precognition, is not. Unit 6 of the masterclass works Bayes' theorem through with natural frequencies, and the logic is the same as for a medical test.
It is not the size of the effect. A p-value depends on the effect and on the sample together. With 20 participants per group, a difference of 3 points may give p = 0.20 and be dismissed; with 2,000 per group, a difference of 0.3 points gives p below 0.001 and gets a headline. Nothing about the importance of the difference has changed. With a large enough sample almost any difference is significant, because almost no two treatments are exactly equal. The question "does it matter" is answered by the effect size, and a paper that reports a p-value without one has told you half the story.
It is not the probability that a replication will succeed. A study with p = 0.05 has, if the effect is exactly as large as estimated, roughly a 50% chance of giving a significant result when repeated with the same sample size. The 2015 Reproducibility Project found that studies with p near 0.05 replicated far less often than studies with p below 0.001, which is one of the reasons for reading a result that scrapes under the line with care.
What to read instead, or as well
Cohen's d is the difference between two means divided by the pooled standard deviation. It says how far apart the groups are in units of how spread out people are. A d of 0.2 is conventionally called small, 0.5 medium, and 0.8 large, and the conventions, like 0.05, are rough. A d of 0.2 means the two distributions overlap by about 92%, so that if you picked one person from each group at random, the one from the better group would score higher only about 56% of the time. For a correlation, r does the same job. The average effect in social psychology, across more than 25,000 studies reviewed in 2003, is about r = 0.21, which is to say small by the convention and typical of the field.
The 95% confidence interval gives the range of effect sizes compatible with the data. A result of d = 0.4 with an interval from 0.05 to 0.75 is significant and tells you that the effect could be trivial or large. The same estimate with an interval from 0.3 to 0.5 tells you a great deal more. The width of the interval is a direct reading of how much the study can say, and it is the first thing to look at after the sample size.
Statistical power is the probability that a study will find an effect of a given size if it is there. A study of 20 per group has about 30% power to detect d = 0.5. Such a study that finds a significant result has not become more trustworthy by being lucky; the significant results of low-powered studies are, on average, overestimates, because only the samples that happened to show a large difference crossed the line. Reviewers now ask for power calculations in advance, and a reader can ask the same question: was this study large enough to find what it claims to have found?
A worked example
Roediger and Karpicke (2006) had students either read a passage four times or read it once and recall it three times. A week later the reread group remembered about 40% of the ideas and the recall group about 61%. The difference was significant with a small sample, but the figure that makes the result useful is the size: 21 percentage points, or a d above 1, from the same time spent studying. If the difference had been 2 points and p = 0.04 with 400 students, the testing effect would be true and nobody would change how they revise. The paper is at the journal.
Where the conventions stand
In 2016 the American Statistical Association published a statement on p-values with six principles, of which the third is the one to remember: scientific conclusions and policy decisions should not be based only on whether a p-value passes a threshold. In 2018, 72 researchers proposed in Nature Human Behaviour that claims of new discoveries should require p below 0.005, and the argument and the replies are a good short education in what the number can do. Some journals have stopped using the word significant. Most psychologists still report p-values, and will for a long time, because they answer a question that has to be asked. The skill is knowing which question that is.
Reading a p-value correctly takes about an hour to learn and is used in every unit of the masterclass after the first. Unit 1 defines it, computes a standard deviation and a Cohen's d by hand, and gives the sample sizes that an effect of each size needs, which is the knowledge that turns a reader of abstracts into a reader of results.